By using this site, you agree to the Privacy Policy and Terms of Use.
Accept
10alert.com10alert.com
  • Threats
    • WordPress ThreatsDanger
    Threats
    A cyber or cybersecurity threat is a malicious act that seeks to damage data, steal data, or disrupt digital life in general. Cyber threats include…
    Show More
    Top News
    A Malware Classification -Kaspersky Daily
    8 months ago
    Superfish: adware preinstalled on Lenovo laptops
    8 months ago
    Russian-speaking cyber spies from Turla APT group exploit satellites
    8 months ago
    Latest News
    Triangulation: Trojan for iOS | Kaspersky official blog
    5 days ago
    Wordfence Intelligence Weekly WordPress Vulnerability Report (May 22, 2023 to May 28, 2023)
    5 days ago
    Safeguards against firmware signed with stolen MSI keys
    7 days ago
    WPDeveloper Addresses Privilege Escalation Vulnerability in ReviewX WordPress Plugin
    7 days ago
  • Fix
    Fix
    Troubleshooting guide you need when errors, bugs or technical glitches might ruin your digital experience.
    Show More
    Top News
    Surface Pro released and the 128 GB version already sold out at the online Microsoft Store [Updated]
    8 months ago
    Windows 11 build 22622.590 (KB5017846) outs in the Beta Channel
    8 months ago
    How to protect computer from virus and hackers on Windows 11
    8 months ago
    Latest News
    How automatically delete unused files from my Downloads folder?
    4 months ago
    Now you can speed up any video in your browser
    4 months ago
    How to restore access to a file after EFS or view it on another computer?
    4 months ago
    18 Proven Tips to Speed Up Your WordPress Site and Improve SEO | 2023 Guide
    5 months ago
  • How To
    How ToShow More
    Nine years of Project Galileo and how the last year has changed it
    Nine years of Project Galileo and how the last year has changed it
    20 hours ago
    Dynamic data collection with Zaraz Worker Variables
    Dynamic data collection with Zaraz Worker Variables
    4 days ago
    Reduce latency and increase cache hits with Regional Tiered Cache
    Reduce latency and increase cache hits with Regional Tiered Cache
    5 days ago
    Cloudflare is deprecating Railgun
    Cloudflare is deprecating Railgun
    5 days ago
    What is two-factor authentication | Kaspersky official blog
    1 week ago
  • News
    News
    This category of resources includes the latest technology news and updates, covering a wide range of topics and innovations in the tech industry. From new…
    Show More
    Top News
    Easter egg “I am a teapot” on Google
    8 months ago
    How to block ads with Adguard DNS in Android
    8 months ago
    How to reduce video quality in Chrome?
    8 months ago
    Latest News
    How to generate SSH keys on Windows 11
    10 hours ago
    How to enable file sharing on WSA for Windows 11
    10 hours ago
    How to add CPU, GPU, RAM widgets on Windows 11
    5 days ago
    How to create virtual drive (VHD, VHDX, Dev Drive) on Windows 11
    1 week ago
  • Glossary
  • My Bookmarks
Reading: better visibility over all domains
Share
Notification Show More
Aa
Aa
10alert.com10alert.com
  • Threats
  • Fix
  • How To
  • News
  • Glossary
  • My Bookmarks
  • Threats
    • WordPress ThreatsDanger
  • Fix
  • How To
  • News
  • Glossary
  • My Bookmarks
Follow US
Apps

better visibility over all domains

Andra Smith
Last updated: 19 March
Andra Smith 3 months ago
Share
8 Min Read

Account Security Analytics and Events: better visibility over all domains

Contents
The zone-level overview sometimes is not time efficientHow do customers get visibility over security traffic today?Introducing Account Security Analytics and EventsAnalytics walk-through when investigating a spike in trafficWho gets the new views?What’s next?

Cloudflare offers many security features like WAF, Bot management, DDoS, Zero Trust, and more! This suite of products are offered in the form of rules to give basic protection against common vulnerability attacks. These rules are usually configured and monitored per domain, which is very simple when we talk about one, two, maybe three domains (or what we call in Cloudflare’s terms, “zones”).

The zone-level overview sometimes is not time efficient

If you’re a Cloudflare customer with tens, hundreds, or even thousands of domains under your control, you’d spend hours going through these domains one by one, monitoring and configuring all security features. We know that’s a pain, especially for our Enterprise customers. That’s why last September we announced the Account WAF, where you can create one security rule and have it applied to the configuration of all your zones at once!

Account WAF makes it easy to deploy security configurations. Following the same philosophy, we want to empower our customers by providing visibility over these configurations, or even better, visibility on all HTTP traffic.

Today, Cloudflare is offering holistic views on the security suite by launching Account Security Analytics and Account Security Events. Now, across all your domains, you can monitor traffic, get insights quicker, and save hours of your time.

How do customers get visibility over security traffic today?

Before today, to view account analytics or events, customers either used to access each zone individually to check the events and analytics dashboards, or used zone GraphQL Analytics API or logs to collect data and send them to their preferred storage provider where they could collect, aggregate, and plot graphs to get insights for all zones under their account — in case ready-made dashboards were not provided.

Introducing Account Security Analytics and Events

Snapshot highlighting Security Analytics and Events location in the dashboard sidebar

The new views are security focused, data-driven dashboards — similar to zone-level views, both have  similar data like: sampled logs and the top filters over many source dimensions (for example, IP addresses, Host, Country, ASN, etc.).

The main difference between them is that Account Security Events focuses on the current configurations on every zone you have, which makes reviewing mitigated requests (rule matches) easy. This step is essential in distinguishing between actual threats from false positives, along with maintaining optimal security configuration.

Part of the Security Events power is showing Events “by service” listing the security-related activity per security feature (for example, WAF, Firewall Rules, API Shield) and Events “by Action” (for example, allow, block, challenge).

On the other hand, Account Security Analytics view shows a wider angle with all HTTP traffic on all zones under the account, whether this traffic is mitigated, i.e., the security configurations took an action to prevent the request from reaching your zone, or not mitigated. This is essential in fine-tuning your security configuration, finding possible false negatives, or onboarding new zones.

The view also provides quick filters or insights of what we think are interesting cases worth exploring for ease of use. Many of the view components are similar to zone level Security Analytics that we introduced recently.

To get to know the components and how they interact, let’s have a look at an actual example.

Analytics walk-through when investigating a spike in traffic

Traffic spikes happen to many customers’ accounts; to investigate the reason behind them, and check what’s missing from the configurations, we recommend starting from Analytics as it shows mitigated and non-mitigated traffic, and to revise the mitigated requests to double check any false positives then Security Events is the go to place. That’s what we’ll do in this walk-through starting with the Analytics, finding a spike, and checking if we need further mitigation action.

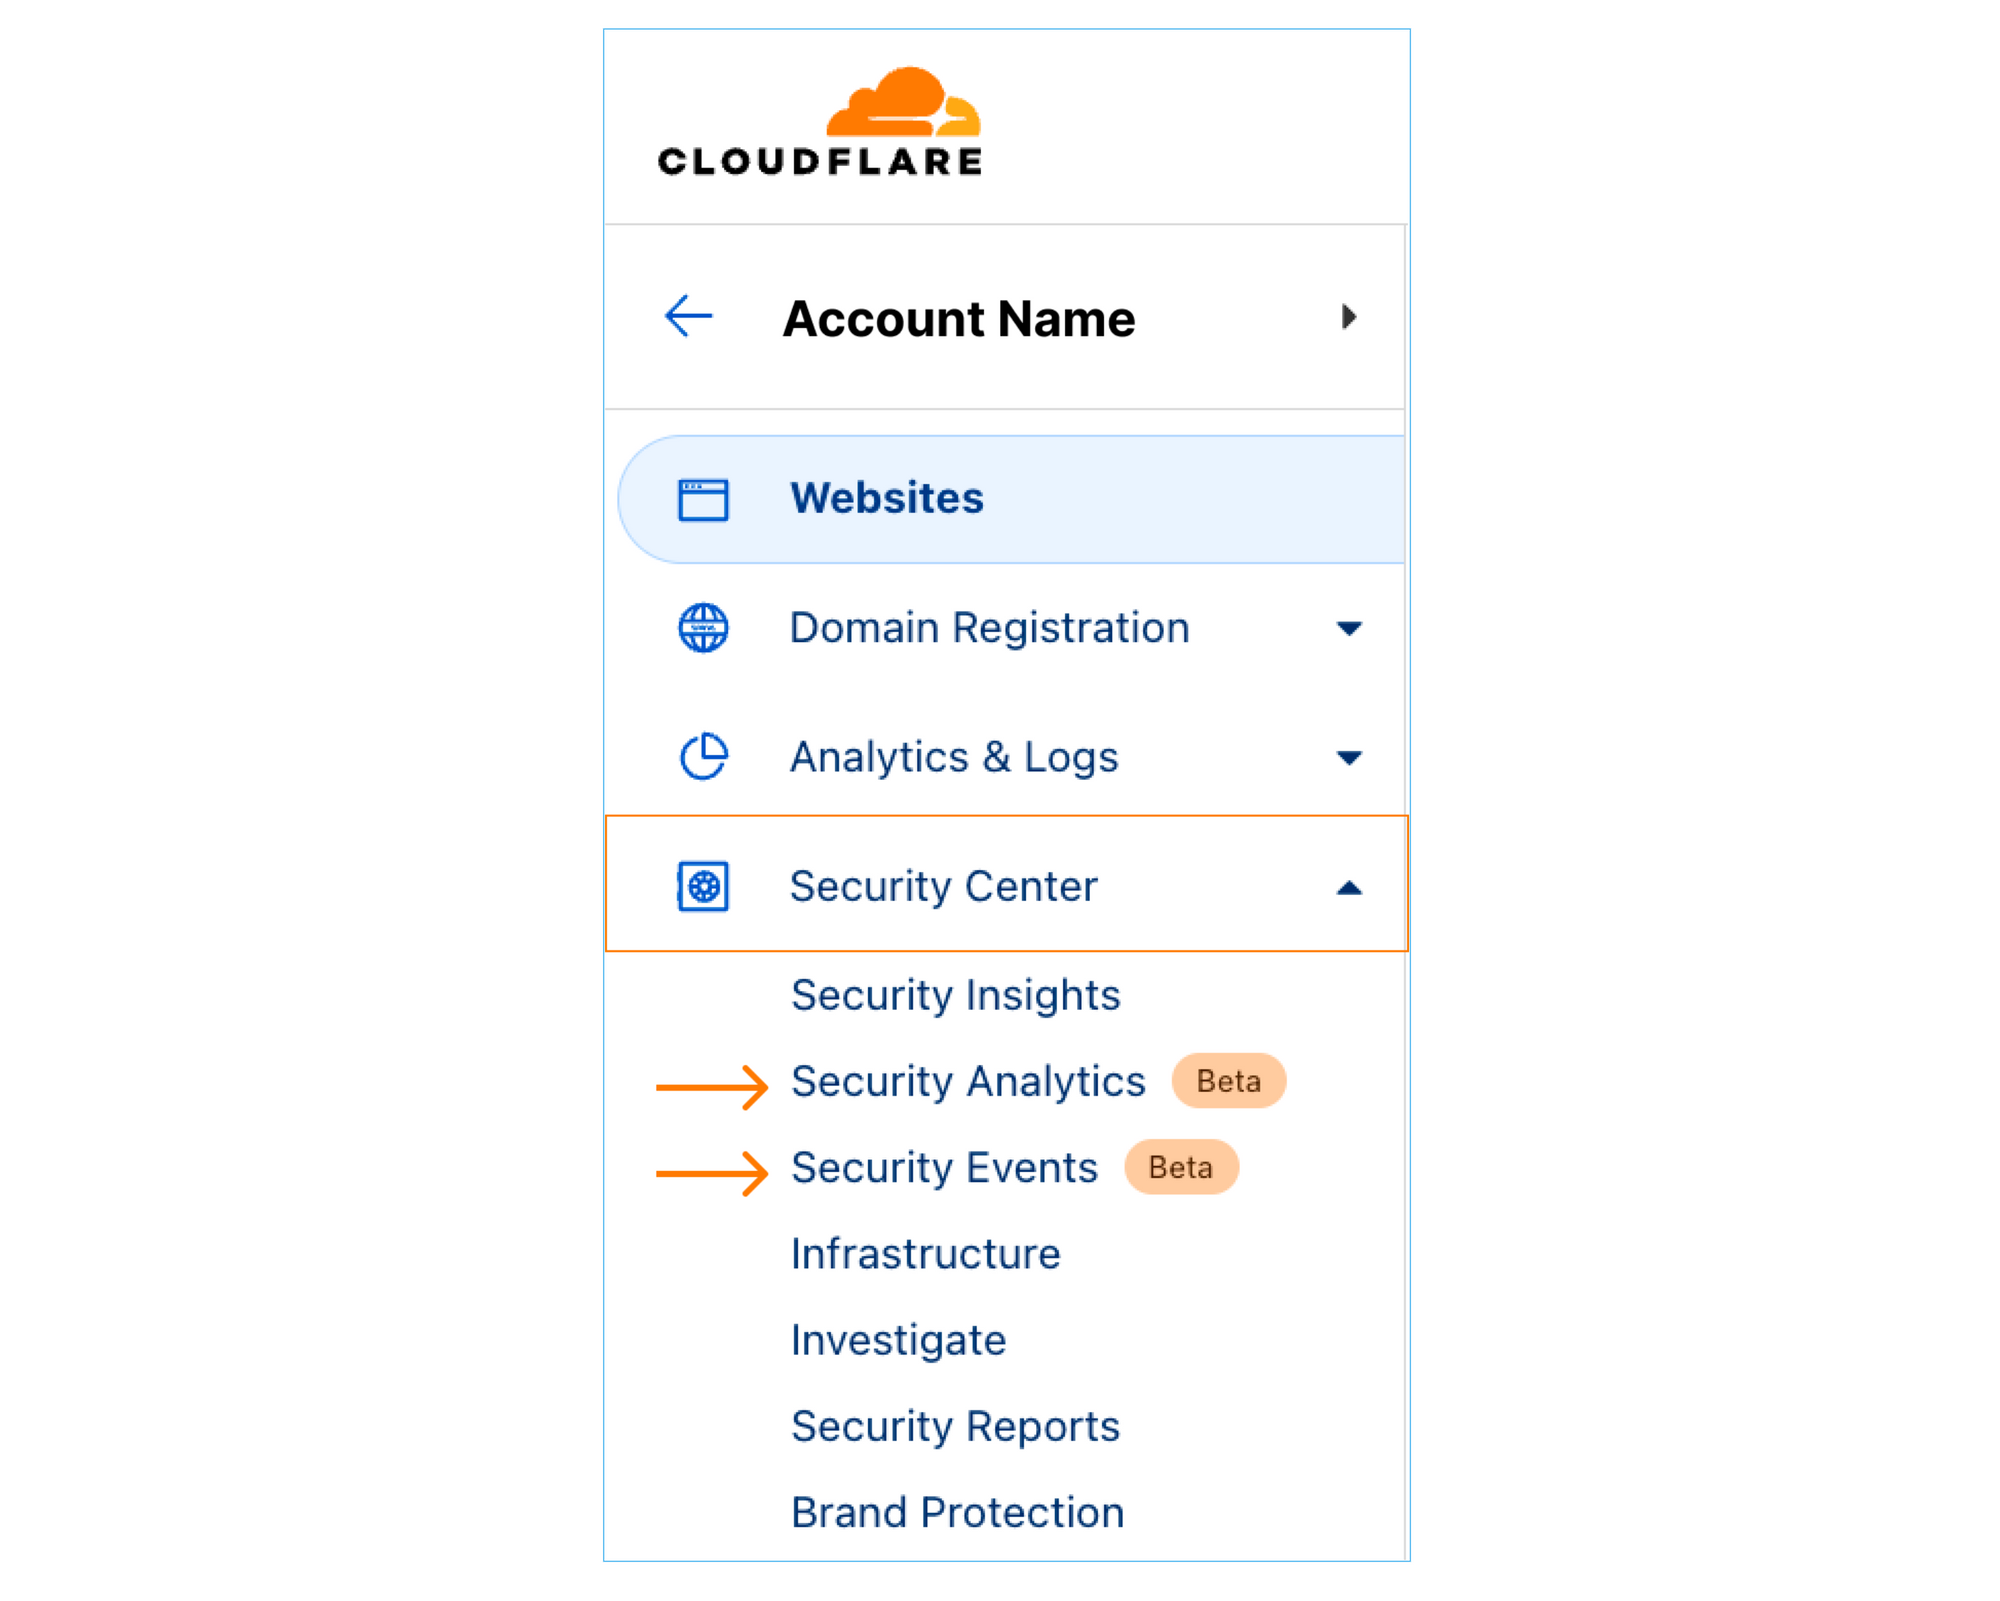
Step 1: To navigate to the new views, sign into the Cloudflare dashboard and select the account you want to monitor. You will find Security Analytics and Security Events in the sidebar under Security Center.

Screenshot displaying the full Account Security Analytics view through the dashboard

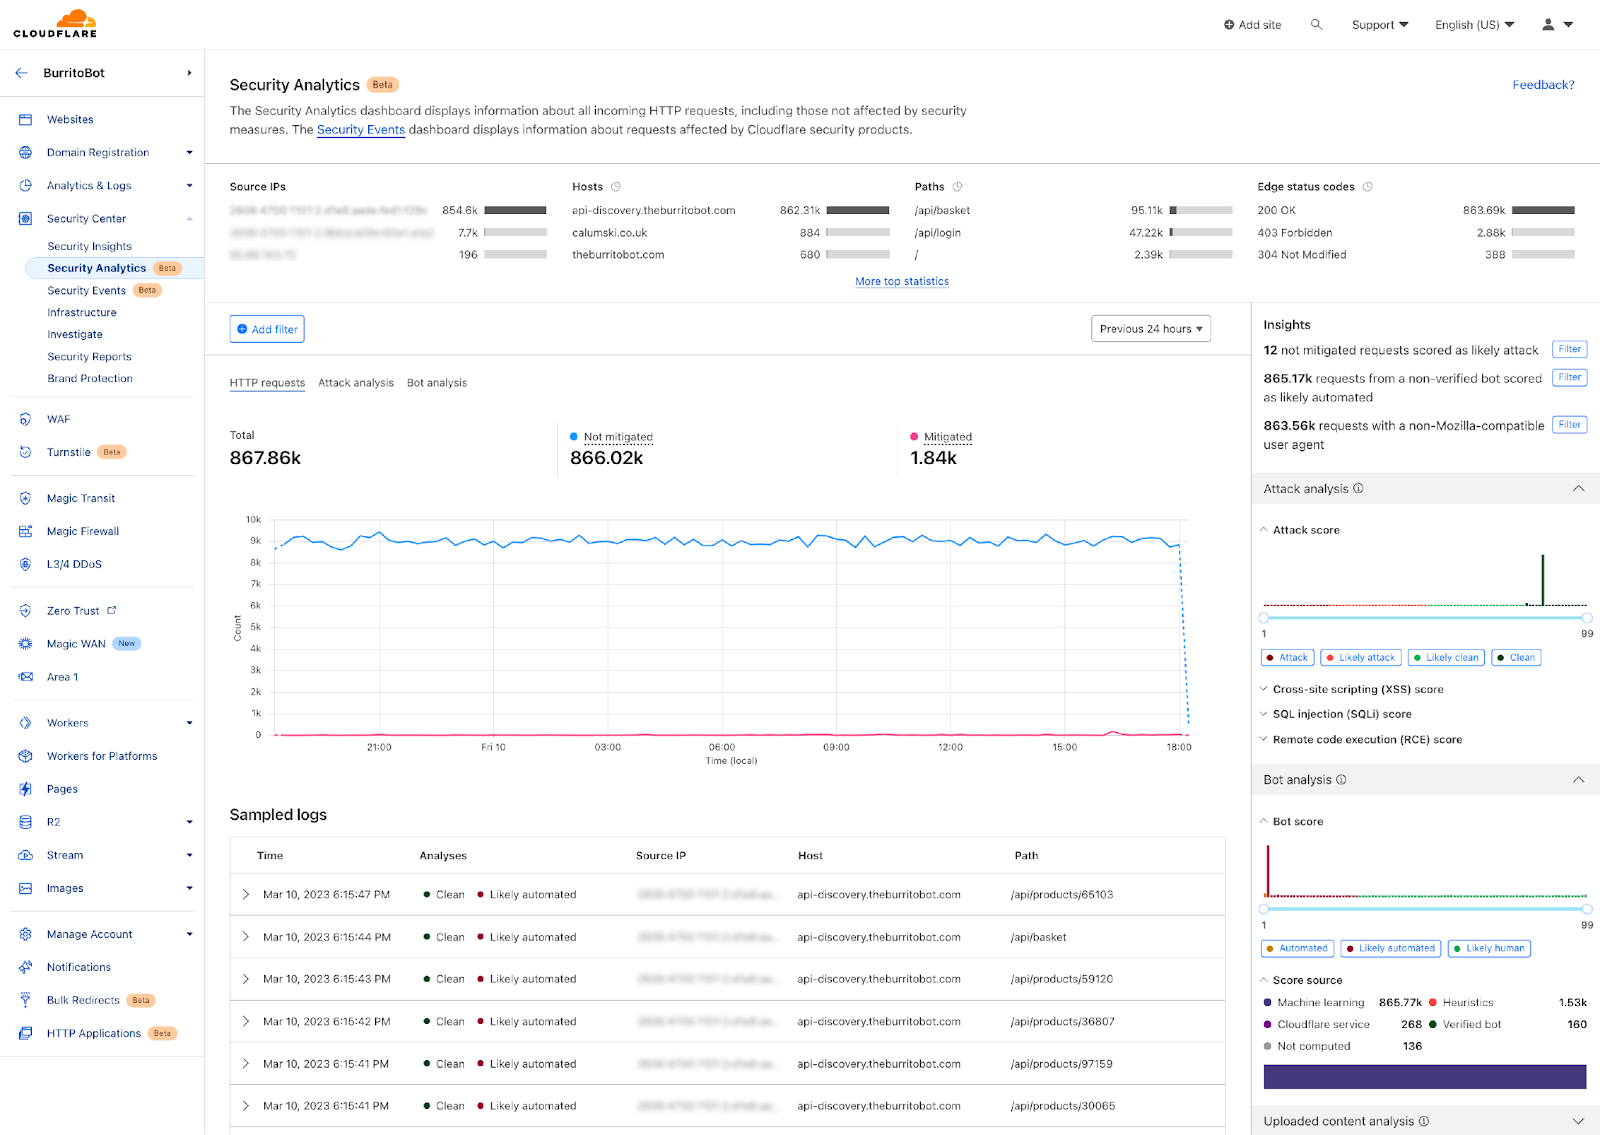
Step 2: In the Analytics dashboard, if you had a big spike in the traffic compared to the usual, there’s a big chance it’s a layer 7 DDoS attack. Once you spot one, zoom into the time interval in the graph.

Zooming into a traffic spike on the timeseries scale

By Expanding the top-Ns on top of the analytics page we can see here many observations:

Screenshot showing Analytics top Ns for traffic spike analysis

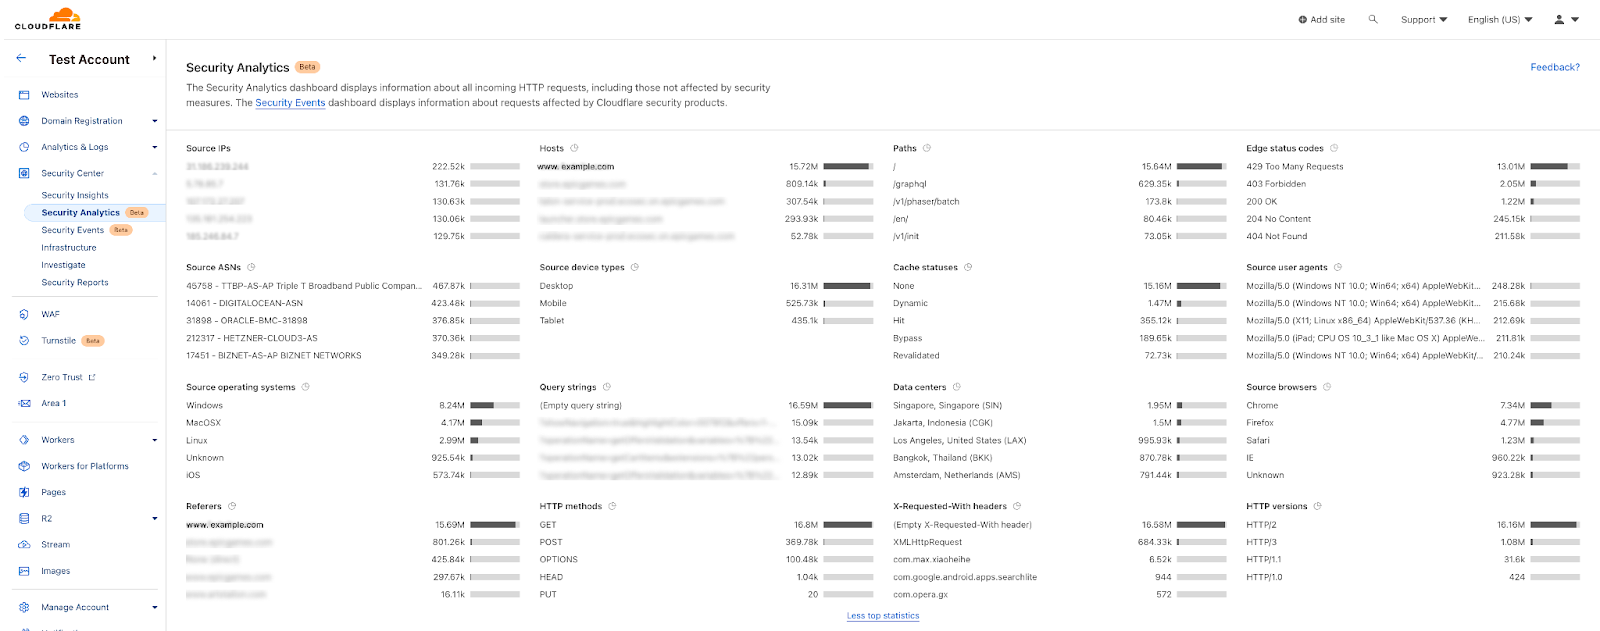
We can confirm it’s a DDoS attack as the peak of traffic does not come from one single IP address, It’s distributed over multiple source IPs. The “edge status code” indicates that there’s a rate limiting rule applied on this attack and it’s a GET method over HTTP/2.

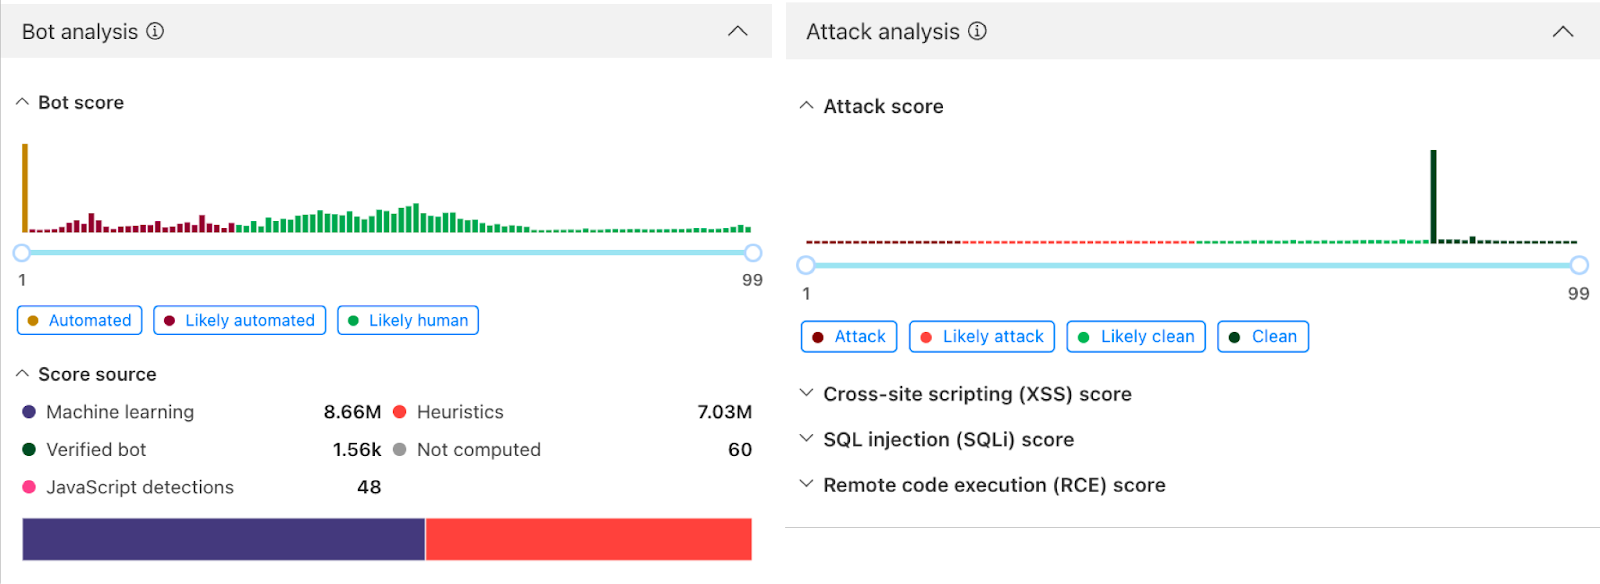
Looking at the right hand side of the analytics we can see “Attack Analysis” indicating that these requests were clean from XSS, SQLi, and common RCE attacks. The Bot Analysis indicates it’s an automated traffic in the Bot Scores distribution; these two products add another layer of intelligence to the investigation process. We can easily deduce here that the attacker is sending clean requests through high volumetric attack from multiple IPs to take the web application down.

Display of Attack Analysis and Bot Analysis from Security Analytics dashboard

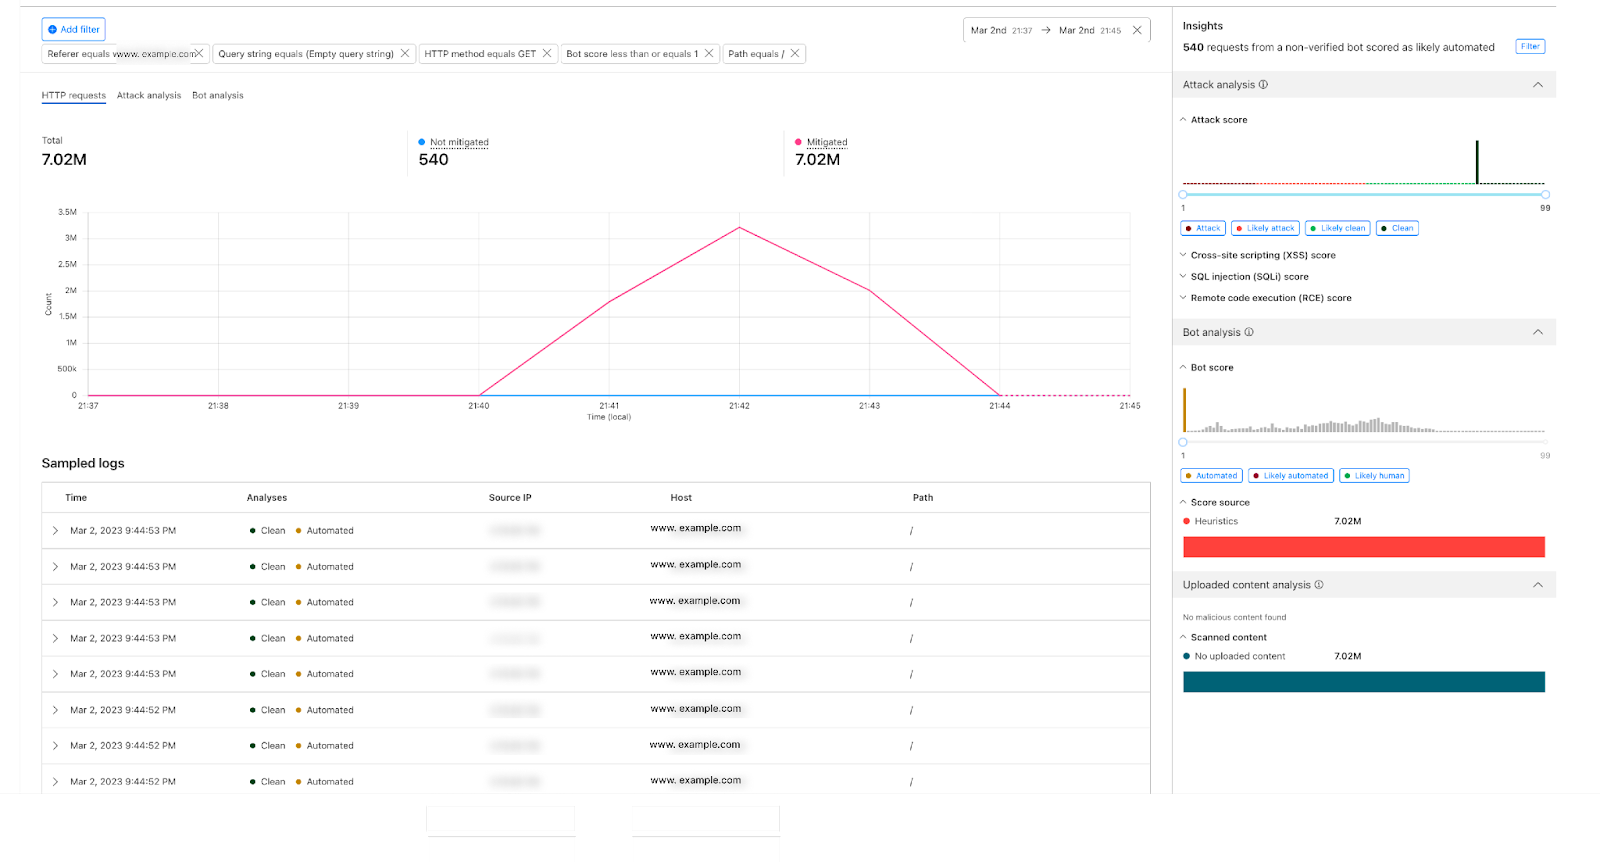
Step 3: For this attack we can see we have rules in place to mitigate it, with the visibility we get the freedom to fine tune our configurations to have better security posture, if needed. we can filter on this attack fingerprint, for instance: add a filter on the referer `www.example.com` which is receiving big bulk of the attack requests, add filter on path equals `/`, HTTP method, query string, and a filter on the automated traffic with Bot score, we will see the following:

Using the Analytics’ filters to get to the fingerprint identifying the Attack

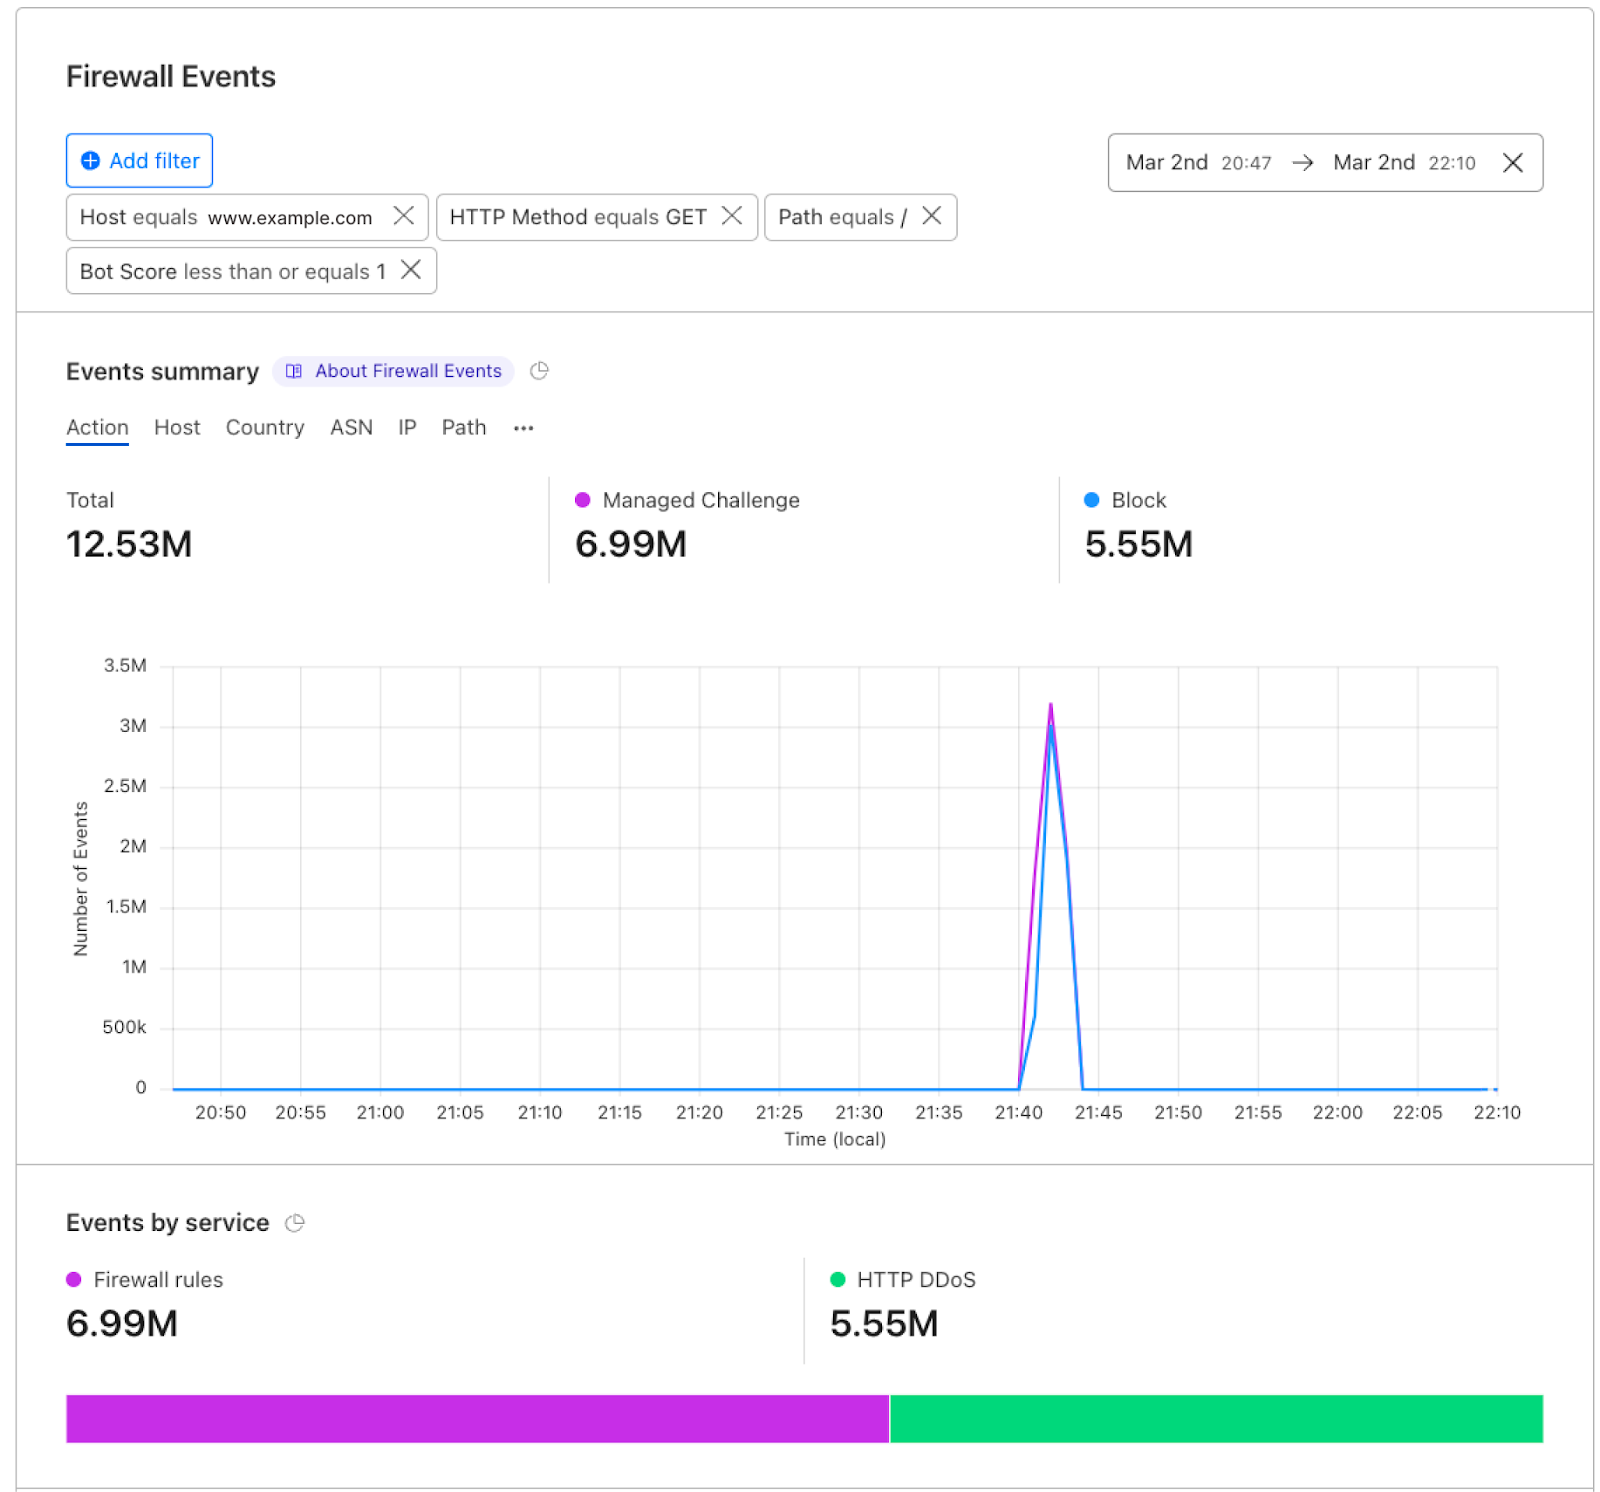
Step 4: Jumping to Security Events to zoom in on our mitigation actions in this case, spike fingerprint is mitigated using two actions: Managed Challenge and Block.

Screenshot of the traffic spike distribution in the Security Events

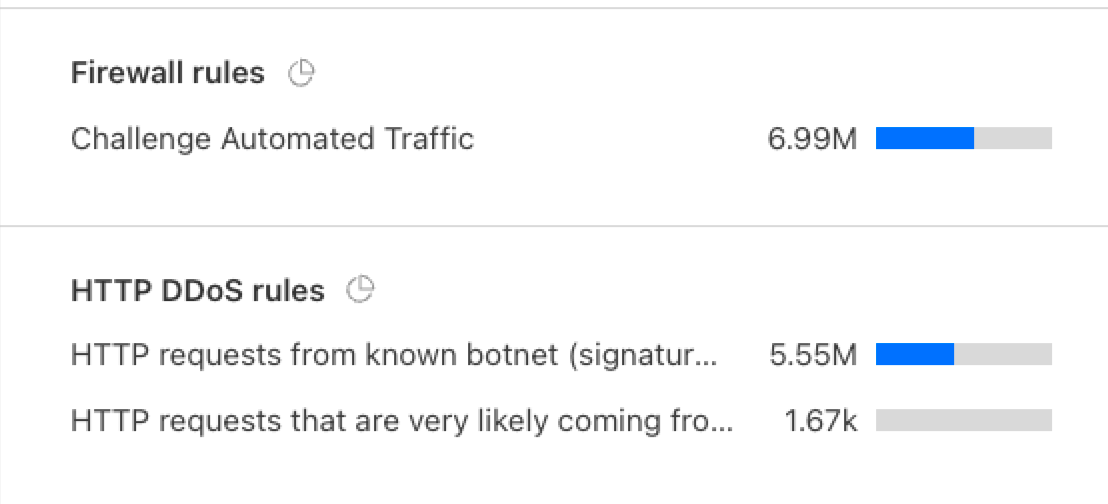
The mitigation happened on: Firewall rules and DDoS configurations, the exact rules are shown in the top events.

Mitigation rules used as shown in the top events of the attack

Who gets the new views?

Starting this week all our customers on Enterprise plans will have access to Account Security Analytics and Security Events. We recommend having Account Bot Management, WAF Attack Score, and Account WAF to have access to the full visibility and actions.

What’s next?

The new Account Security Analytics and Events encompass metadata generated by the Cloudflare network for all domains in one place. In the upcoming period we will be providing a better experience to save our customers’ time in a simple way. We’re currently in beta, log into the dashboard, check out the views, and let us know your feedback.


Source: cloudflare.com

Translate this article

TAGGED: Cloudflare, Security, Threat
Andra Smith March 19, 2023 March 19, 2023
Share this Article
Facebook Twitter Reddit Telegram Email Copy Link Print

STAY CONECTED

24.8k Followers Like
253.9k Followers Follow
33.7k Subscribers Subscribe
124.8k Members Follow

LAST 10 ALERT

How to generate SSH keys on Windows 11
News 13 hours ago
How to enable file sharing on WSA for Windows 11
News 13 hours ago
Nine years of Project Galileo and how the last year has changed it
Apps 20 hours ago
Dynamic data collection with Zaraz Worker Variables
Apps 4 days ago
How to add CPU, GPU, RAM widgets on Windows 11
News 5 days ago

Recent Posts

  • How to generate SSH keys on Windows 11
  • How to enable file sharing on WSA for Windows 11
  • Nine years of Project Galileo and how the last year has changed it
  • Dynamic data collection with Zaraz Worker Variables
  • How to add CPU, GPU, RAM widgets on Windows 11

You Might Also Like

News

How to generate SSH keys on Windows 11

13 hours ago
Nine years of Project Galileo and how the last year has changed it
Apps

Nine years of Project Galileo and how the last year has changed it

20 hours ago
Dynamic data collection with Zaraz Worker Variables
Apps

Dynamic data collection with Zaraz Worker Variables

4 days ago
Reduce latency and increase cache hits with Regional Tiered Cache
Apps

Reduce latency and increase cache hits with Regional Tiered Cache

5 days ago
Show More

Related stories

How to Use Cloudflare to Secure Your WordPress Site
How To Starting Chrome from the command line
How to fix error 0x80070057 in Chrome?
Windows 10 How To Disable Slide to Shutdown
Windows search not working (FIX)
How to watch movies and TV series for free on Kinopoisk?
Previous Next

10 New Stories

Reduce latency and increase cache hits with Regional Tiered Cache
Cloudflare is deprecating Railgun
Triangulation: Trojan for iOS | Kaspersky official blog
Wordfence Intelligence Weekly WordPress Vulnerability Report (May 22, 2023 to May 28, 2023)
Safeguards against firmware signed with stolen MSI keys
WPDeveloper Addresses Privilege Escalation Vulnerability in ReviewX WordPress Plugin
Previous Next
Hot News
How to generate SSH keys on Windows 11
How to enable file sharing on WSA for Windows 11
Nine years of Project Galileo and how the last year has changed it
Dynamic data collection with Zaraz Worker Variables
How to add CPU, GPU, RAM widgets on Windows 11
10alert.com10alert.com
Follow US

© 10 Alert Network. All Rights Reserved.

  • Privacy Policy
  • Contact
  • Customize Interests
  • My Bookmarks
  • Glossary
Go to mobile version
adbanner
AdBlock Detected
Our site is an advertising supported site. Please whitelist to support our site.
Okay, I'll Whitelist
Welcome Back!

Sign in to your account

Lost your password?